
In a previous post, we looked into the historical breakdown of NFL scoring. During that post I suggested that we might expect around 60-65% of scoring this season to be touchdowns and 35-40% to be field goals. After 10 weeks of the current 2015 NFL season, I was curious whether my assessment was close and wanted to see a breakdown of NFL scoring by minute. Of particular interest is increased scoring at the end of each half and to what extent scoring spikes account for total game scoring. So I collected data from ESPN on each scoring play for the 145 games played through 10 weeks of the current season.
NFL Scoring by Minute
Below is a minute by minute breakdown of the scoring so far this season. The first things that stand out are the scoring spikes occurring at the end of each half as expected. In the last 2 minutes of the 1st half alone, around 13% of field goals and 7.5% of touchdowns are scored. The second although less obvious take from the graphic is that around 25% of touchdowns are scored in the last 10 minutes of the game. Each half it takes teams about 4-5 minutes to get the scoring started in most games.
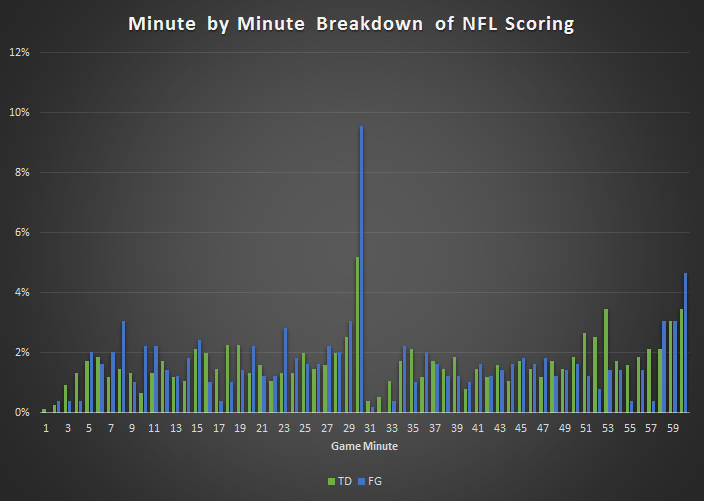
Data are through 10 weeks of 2015 NFL season.
NFL Scoring in Final 2 Minutes
If you’ve watched many NFL games then you will know that field goals tend to increase toward the end of each half. Below I have depicted the touchdown to field goal breakdown before and after the 2 minute warning in each half. Of note is that at the end of the 1st half, there’s actually a higher percentage of field goals than touchdowns.
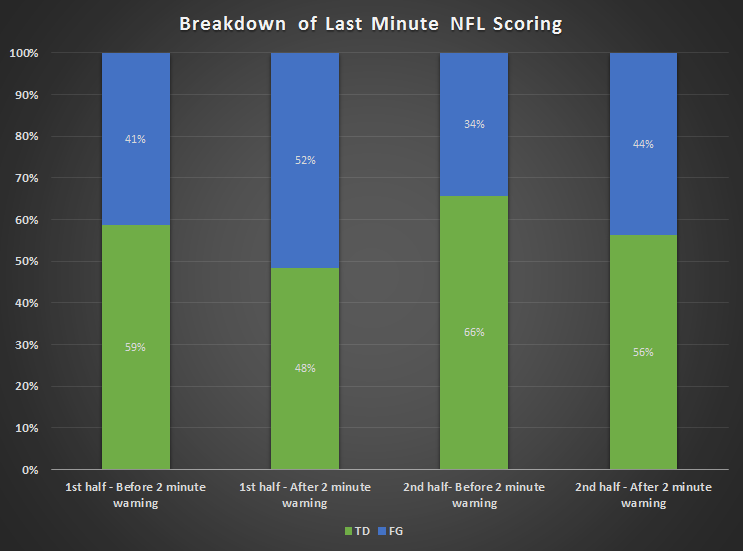
Data are through 10 weeks of 2015 NFL season.
I can think of many reasons why scoring increases in the last 2 minutes of each half. The main reason is that there are actually many more plays per game minute during these times. In general, I would expect scoring to increase with more offensive plays but that’s only one part of the equation. The second part is that defenses will play soft coverage in many late game situations and right before halftime so they will sometimes give up easy scores.
Let’s first look into the increased number of plays. In the final 2 minutes of the first half and final 5 minutes of the second half, the clock stops when a runner goes out of bounds. This is in addition to the clock stopping on incomplete passes and for timeouts which are often saved for the final few minutes. These clock stoppages help increase the number of plays toward the end of each half. Furthermore, when teams run their hurry up offense, they spend much less time in the huddle which also increases the number of plays that can be run.
The play calling also affects the number of plays and scoring. Offenses tend to throw more passes at the end of the half and defenses tend to play soft covers to prevent big plays. Soft coverage often leads to dink and dunk passes with the team quickly marching into field goal range. Throw in the fact that player substitutions are often prevented during hurry up situations and you have more tired defenses being burned or giving up quick plays. I also think that at least during the 1st half, the defense is trying to get to halftime without giving up a demoralizing touchdown so they so they’re willing to give up short yardage. This leads to increased field goal attempts.
The spike in field goals at the end of the first half can also be attributed to willingness to try long field goals. At the end of the half, the team with the ball no longer needs to worry about giving up field position so it’s easier to take a risk on a long field goal. Although kickers may not be as accurate from these longer distances, they are given many more opportunities than in other times of the game. The spike is not as high at the end of the game, because teams are focused on winning rather than just putting points on the board.
NFL Scoring by Quarter
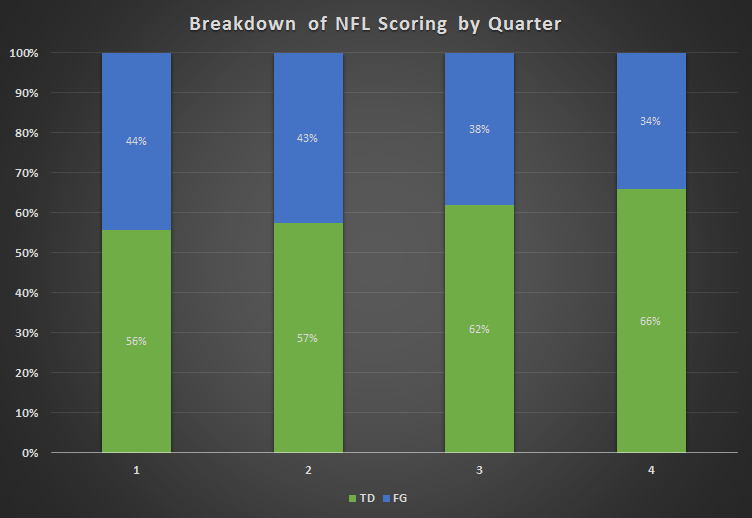
Data are through 10 weeks of 2015 NFL season.
In the first graphic, it’s difficult to get a general feel for the progression of scoring by quarter since the minute by minute scoring variability is relatively high. I aggregated the data by quarter and have plotted the touchdown to field goal percentage above. Recall the historical value is around 60% touchdowns and 40% field goals. In the graphic we see that the touchdown to field goal ratio generally increases each quarter. A large part of this is attributed to the field goal spikes previously mentioned at the end of the first half and the increased number of touchdowns scored at the end of regulation. But there’s actually more to it than that. We further broke down the data into whether the scoring team was the home or visiting team. What we found was interesting. See below.
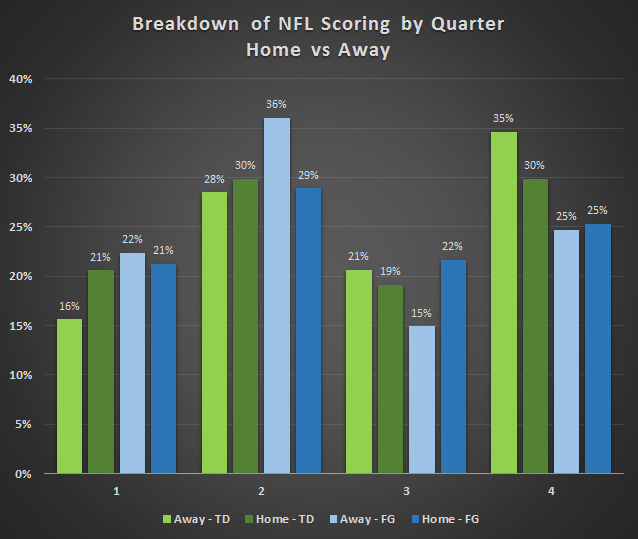
Data are through 10 weeks of 2015 NFL season.
Whereas the home team scores about equal amount of touchdowns in both halves, the visiting team tends to score a larger portion of their touchdowns in the second half. The visiting teams’ field goals follows the opposite trend as they often settle for field goals in the first half and convert touchdowns at a higher rate in the second half. However, some of this is likely garbage time touchdowns just like the garbage time field goals right before halftime.